Debug Spring Boot app in Kubernetes
Debugging a Spring Boot application running on Kubernetes (K8s) can be challenging, especially when the application is deployed in a production environment. Here are some tips to help you debug your Spring Boot application in K8s.
Enable Debugging in Your Spring Boot Application
To enable debugging in your Spring Boot application, you need to add the following line to your config-map of a microservice as an environment variable:
JAVA_TOOL_OPTIONS: -agentlib:jdwp=transport=dt_socket,address=0.0.0.0:8000,
server=y,suspend=n
This will enable debugging on port 8000.
SSL Debugging:
JAVA_TOOL_OPTIONS: -Djavax.net.debug=ALLExpose Debugging Port in Your K8s Deployment
To expose the debugging port in your K8s deployment, you need to add the following lines to your deployment.yaml file:
spec:
  template:
    spec:
      containers:
      - name: container-name
        image: image-name
        ports:
        - name: debug
          containerPort: 8000
This will expose the debugging port on port 8000 in your container.
Port Forwarding to Your Local Machine
To debug your Spring Boot application from your local machine, you need to forward the debugging port to your local machine. You can do this by running the following command:
kubectl port-forward {pod-name} 8000:8000This will forward the debugging port from your K8s pod to your local machine.
To expose the debugging port via K8s service, you can create a service.yaml file with the following contents:
apiVersion: v1
kind: Service
metadata:
  name: service-name
spec:
  selector:
    app: app-name
  ports:
  - name: debug
    port: 8000
    targetPort: 8000
This will create a new service called service-name that maps the debugging port in your container to port 8000 on the service. You can then use the service IP to connect to the debugging port from your local machine.
Debugging Your Spring Boot Application
Once you have forwarded the debugging port to your local machine, you can start debugging your Spring Boot application using your favorite IDE.
In IntelliJ IDEA, you can create a new Remote Debug configuration by going to Run > Edit Configurations, clicking the + button, selecting Remote, and filling in the following fields:
- Name: debug-name
- Host: localhost
- Port: 8000
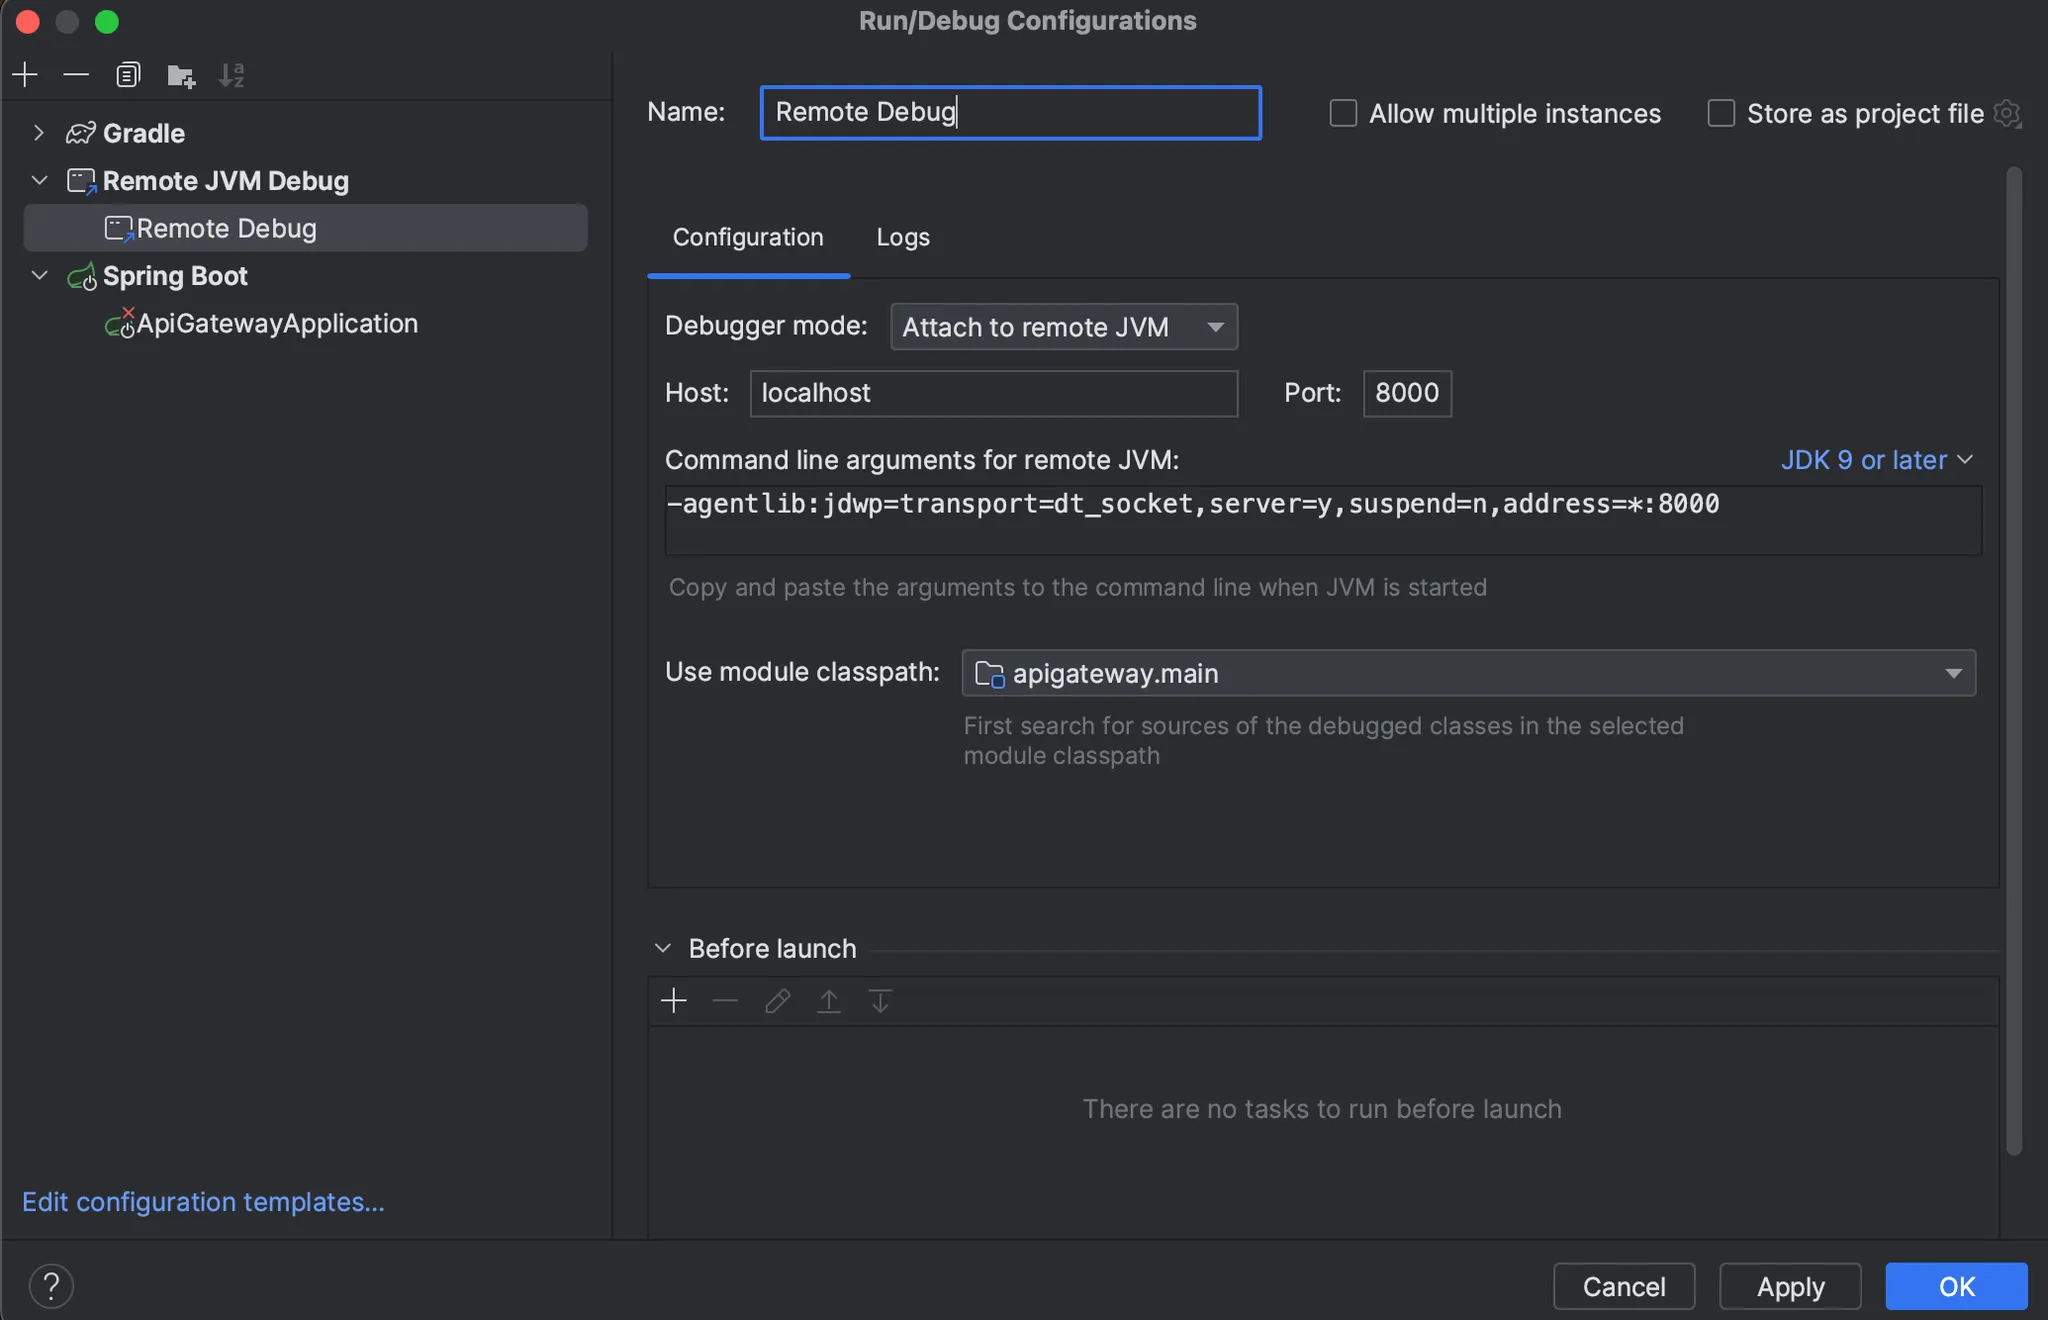
Click Apply and then Debug to start debugging your Spring Boot application.